The Airsonic framework contains a convenient class (called MetricsManager) to add inner metrics that constructs in real time some performance indicators.
The use of MetricsManager is illustrated in the org.airsonic.player.filter.MetricsFilter class.
The MetricsFilter adds a metric based on the time spent by each /main.view HTTP request. This is interesting as the main.view request is invoqued when something is displayed in the main Airsonic web frame.
By default, the MetricsManager is deactivated; it does nothing. It can be activated only by adding the following line inside the airsonic.properties configuration file :
Metrics=
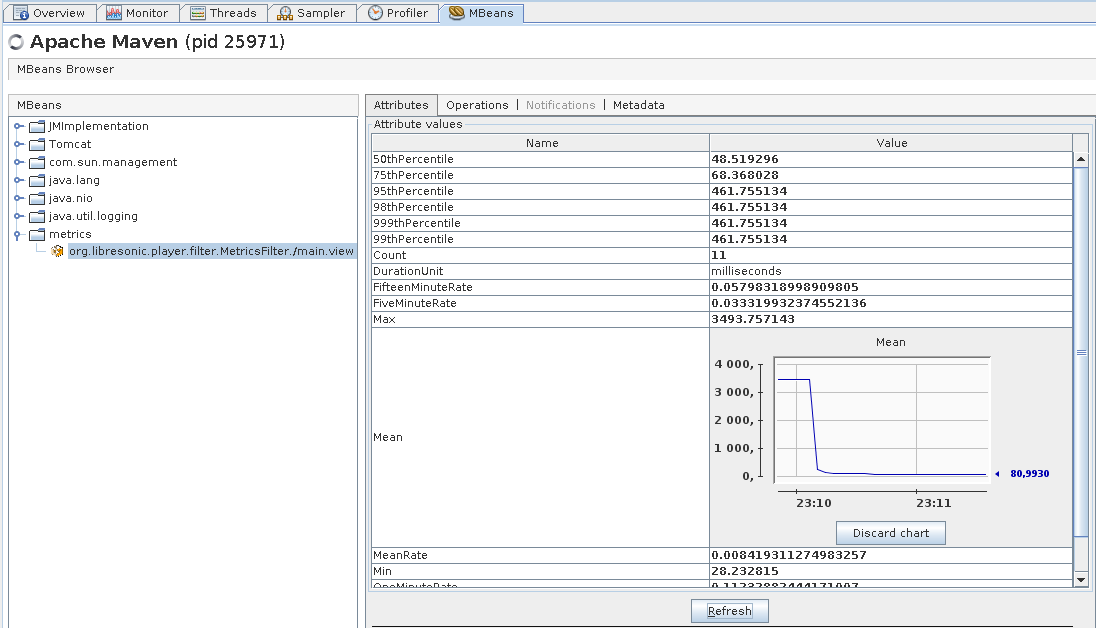
Once the MetricsManager as been activated this way, each metric can be inspected using a jmx console like VisualVM. Each metric is registered as a MBean as shown below.
This document explains how to run performance tests on Airsonic using Apache JMeter. The installation and setup of JMeter is not documented bellow; please refer to the JMeter web site.
The Airsonic sources come with a main performance test case defined in file airsonic-main/src/test/resources/jmeter/airsonicMainTestPlan.jmx. This is a JMeter test plan file.
This test plan simulates a single user that picks up a random album id (xxx) every 5 second and run the main.view?id=xxx http request.
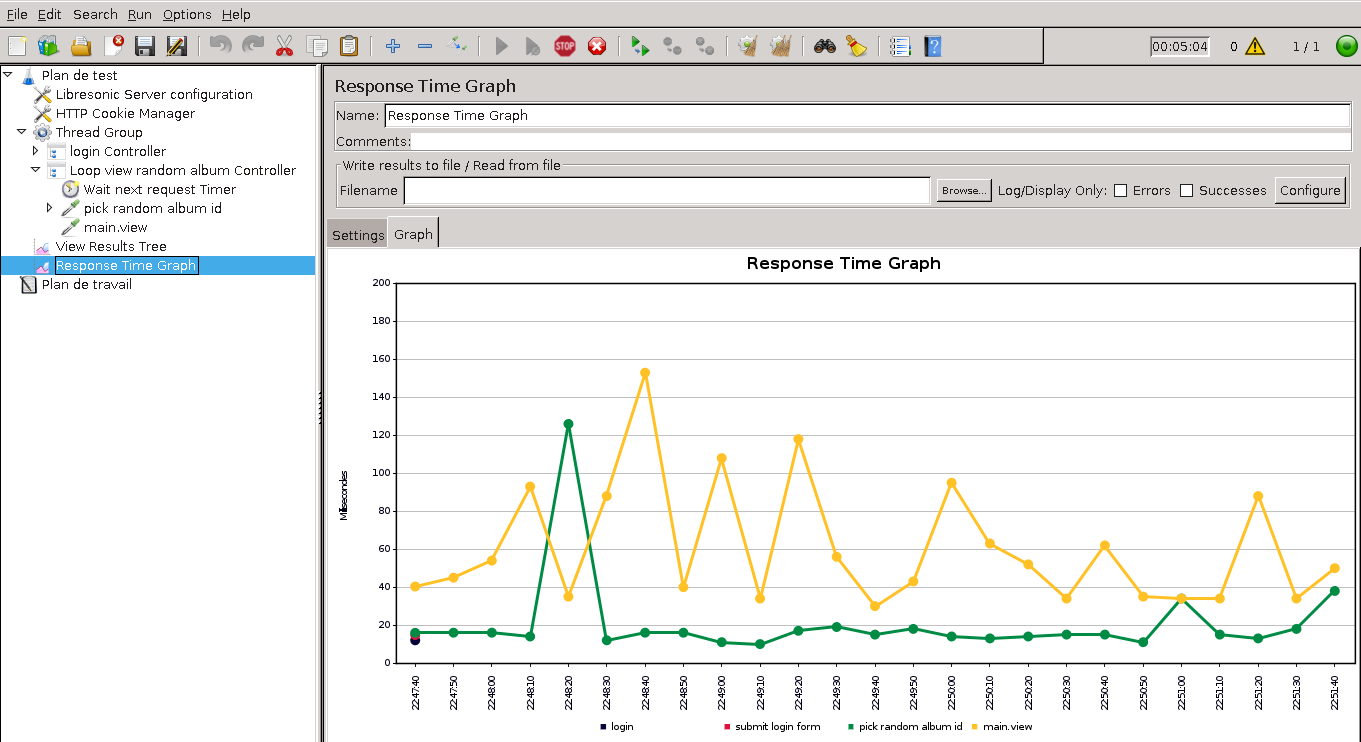
To run the test plan, open the airsonicMainTestPlan.jmx file in JMeter. Run Airsonic. Note that the default configuration of this test plan expects Airsonic to be reached at the http://localhost:8080 URL. Then run the test plan in JMeter. After a while, you’ll obtain a beautiful graph like this
If you want to run the test with more than one user, just change the Number of Threads property in the main Thread Group configuration.
If you want to change the delay between each request, change the value in the Wait next request Timer Constant Timer definition.